Nationwide Surge in June Home Buyer Activity Continues Historic TurnaroundBuyer Demand Jumps in all Regions for the Second Consecutive Month
Key Points:
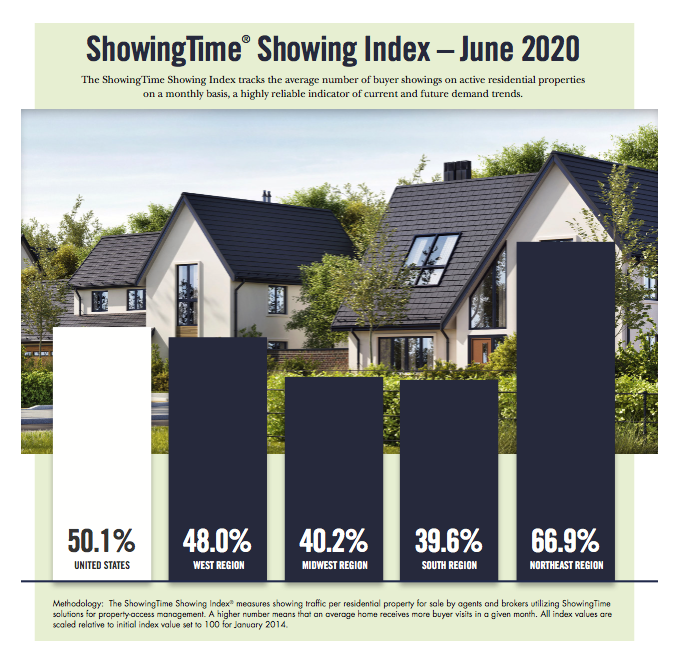
- Showing traffic rose 50.1 percent year over year nationwide in June
- For the second consecutive month, all four regions tracked by the ShowingTime Showing Index
®
reported year-over-year gains, led by the Northeast’s 66.9 percent jump, followed by a 48 percent upswing in the West, a 40.2 percent climb in the Midwest and a 39.6 percent gain in the South
- ShowingTime users continued to leverage virtual showing options in June, with more than 52,000 showings conducted entirely online through ShowingTime to date
Home buyers were out in droves nationwide in June resulting in the second consecutive month of surging home showing activity, with agents seeing 50 percent more showings per listing according to data from the
ShowingTime Showing Index.
June’s 50.1 percent year-over-year jump in nationwide buyer traffic resembled that typically seen in the spring, as agents and buyers made up for pandemic-induced lost time by continuing to leverage historically low mortgage rates and newly available virtual showing technology. Since May, ShowingTime has facilitated more than 52,000 home showings hosted virtually, a number expected to grow throughout the summer.
“In June, we saw the full effect of the rebound in the intensity of buyer traffic in the US,” said ShowingTime Chief Analytics Officer Daniil Cherkasskiy. “The Showing Index tracks the average number of showings per listing, and while the absolute number of showings increased between 13 percent and 15 percent, a substantial increase, the number of showable listings decreased by 23 percent. Thus, the average listing is receiving 50 percent more appointments, concentrated in the first two weeks of the listing’s market time. This unprecedented surge is amplified by the increasing shift of soft interactions between market participants to technology tools, leading to greater efficiency, shorter turnaround times and a larger number of appointments scheduled.”
The Northeast saw the largest jump in year over year showing activity, with a 66.9 percent increase in June. The West Region’s 48 percent boost came next, followed by an increase in the Midwest of 40.2 percent and in the South of 39.6 percent.
In June, ShowingTime LIVE Video, which enables agents and their buyers to use the ShowingTime mobile app to take part in live, interactive video showings, continued to expand into markets across North America. Since it was first made available in select markets in May, ShowingTime LIVE Video has become a popular option for agents to conduct virtual showings for buyers, who participate from the comfort of their own homes.
“We’re pleased to continue helping agents meet pent-up client demand with innovations designed to keep showings going, safely and efficiently,” said ShowingTime President Michael Lane. “The feedback we’ve received so far for ShowingTime LIVE Video has been very positive. We’re looking forward to expanding its availability in markets throughout North America in the weeks and months to come.”
The ShowingTime Showing Index, the first of its kind in the residential real estate industry, is compiled using data from property showings scheduled across the country on listings using ShowingTime products and services, providing a benchmark to track buyer demand. ShowingTime facilitates more than five million showings each month. Released monthly, the Showing Index tracks the average number of appointments received on active listings during the month. Local MLS indices are also available for select markets and are distributed to MLS and association leadership.
