If the lifeblood of any business is a return on revenue, then the critical vital is retained company dollar
When we initially designed and rolled out our benchmark report, the intent was to add an extra dimension of analysis to our valuation product. This analysis offers our clients a snapshot of how they’re doing on the financial front relative to their peers, both nationally and regionally. Not only has this benchmark grown to become an incredibly valuable tool for our clients; it’s become a go-to industry metric.
Trends in Company Dollar
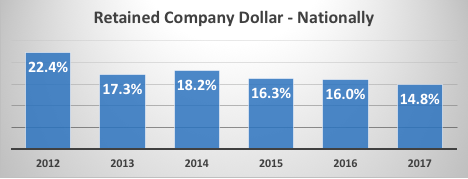
For over six years, we’ve been collecting and compiling financial data on hundreds of residential brokerage firms across the nation. By far, the most important metric we track is retained company dollar. If the lifeblood of any business is a return on revenue, then, in our industry, the key is retained company dollar—how much the brokerage keeps after agents are paid. In 2017, retained company dollar came in at a staggering 14.8 percent, which means that, on average, brokerage firms are now keeping less than 15 cents on the dollar!
To offer some color to this number, consider that only a couple decades ago, the average retained company dollar was double what it is today. Broker/owners have seen a marked decline over the years. As you can see in our chart showing the annual numbers since 2012, the trend continues to push lower.

These numbers represent national averages for all brokerage model types. We do realize that average retained company dollar is materially different in Las Vegas than it is in New York City. We also recognize that it differs between graduated commission plans, cap plans, and 100 percent plans. While we do get granular and take these factors into account as we present this information to our clients, these national averages serve our purpose of expressing the industry’s trend.
Brokers Feeling the Squeeze
With retained company dollar falling by 34% on average since 2012 broker/owners have no doubt been feeling the squeeze. Residential real estate brokerages have been assaulted from seemingly every direction, most notably from the new models employed by the infamous disruptors. As a result, it’s been a constant fight to protect the bottom line.
Operating Expenses
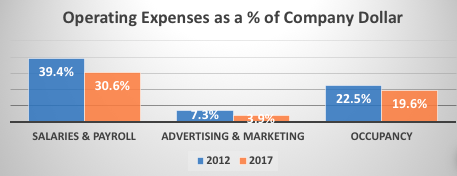
Protecting the bottom line is another aspect of our benchmark report, and the recent update shows some of the areas that brokerages are trimming to stay profitable as their margins decline.
Three of the major expense categories we track are Salaries/Payroll, Advertising/Marketing, and Occupancy. As would be expected, spending in each of these categories has declined from 2012 to 2017. As a percentage of company dollar Salaries/Payroll, Advertising/Marketing and Occupancy have declined by 22 percent, 47 percent, and 13 percent respectively.

As broker/owners lose control of margins above the line, it’s only natural to cut costs to remain profitable. Reducing costs is a grind that’s never easy, but it’s a necessary evil for those brokerages experiencing margin compression.
Looking forward, it will be interesting to see when the downward trend for retained company dollar will flatten out. Unfortunately, early indicators from our benchmark report show that we’re in store for another decline in 2018, which signals a continued grind for residential real estate brokerage firms.


