It has been three years since the COVID-19 pandemic lockdown and three years since I started this video series. At the time, Altos published the videos because we assumed the housing market was about to crater. There were massive layoffs, businesses were shut down and the onset of the COVID-19 pandemic so I wanted to make sure everyone had the real data to keep track of what was actually happening. What we quickly learned was how wrong we were. Americans were buying homes even before the massive economic stimulus started, and we could see it in the data by early April.
In 2023, the market has also been surprising. It’s much milder than the COVID-19 pandemic surprise, but demand is much higher for homes than I expected coming into the year. I’ll show you the data points I’m focusing on now and what they’re telling us about the current surprising housing market.
2023 v.s 2020
In March 2020, people were buying houses. We suddenly saw fewer homes with price cuts. That was a huge surprise! The opposite of what I had assumed happened and the market started racing forward almost immediately. Inventory was falling in April, and we could see changes in the price reduction data. That’s in the chart below.
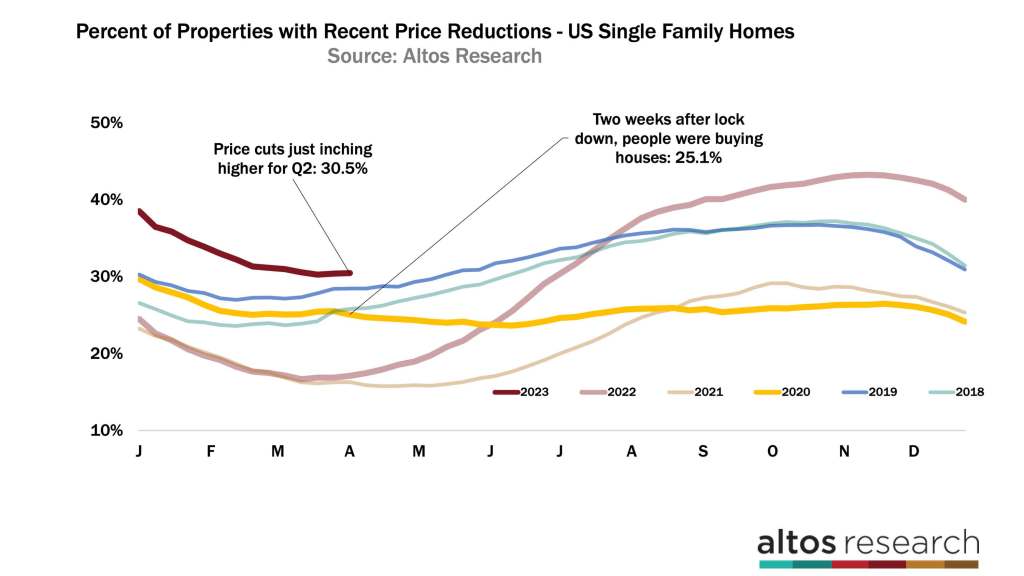
This is the annual curve of the price reduction chart. Each line represents a year. Look at the yellow line from 2020. The curve was normal through March. Just under 30% of homes had a price cut. Then starting in April, boom! People bought the homes so sellers stopped cutting prices. See the yellow line suddenly turns down — fewer price reductions at a time of year when price cuts normally are increasing. If you’d been able at that moment to read what it was telling you about the future, would you have been able to act?
Compare the curve of price cuts to 2023. The dark red line is this year. We still have slightly more price cuts than we did in 2020, but look at how quickly this market recovered after the first of the year. 30.5% of the homes on the market have had a price cut. Down from 40% at the start of the year.
I was talking with a big single-family rental investor this week and they’re still not ready to start buying again. They’re still afraid. My question is: did they miss their window? We can already see the demand that they have to compete with now. Should they have been buying in November? That’s when their price negotiating opportunity was best.
Today’s price reduction data proves that demand is sufficiently high. The buyers are buying at the current asking prices. There are not any signals of further price declines in the data. That can change of course if the economy tanks, but as of now the data is showing home price resiliency.
Inventory
This demand is met with surprisingly little supply. Every week available inventory of homes for sale inches closer to the crisis shortage of the COVID-19 pandemic and further from the normal levels of 2019 or earlier.
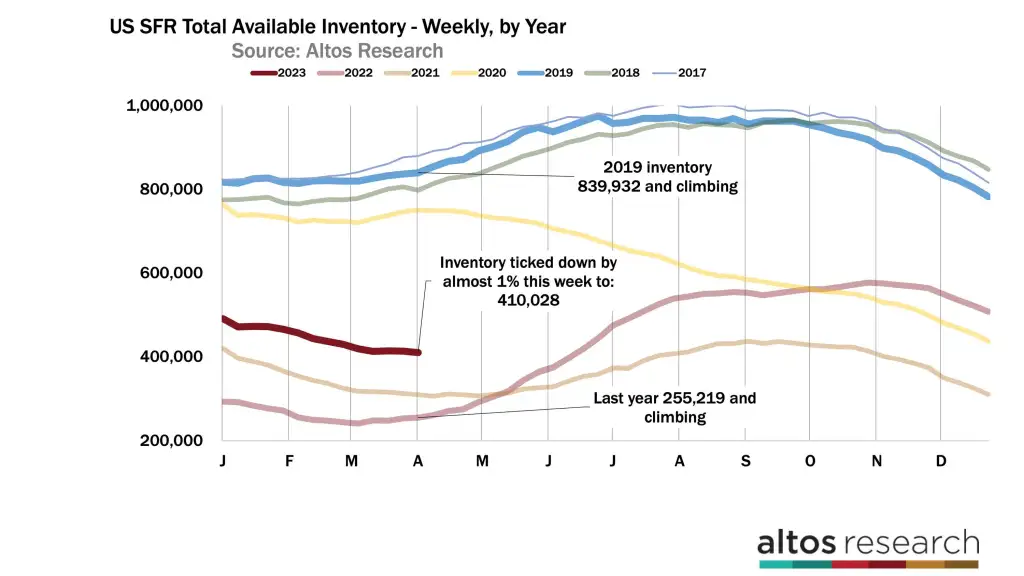
Available inventory of homes for sale fell again this week by almost 1% to 410,000. I thought inventory would hit bottom a week or two ago and that inventory would be climbing by now. However, the fact is that there are so few sellers right now that inventory keeps falling. I’m using this year-over-year chart so you can see how inventory normally climbs by April with the exception of 2020 and 2021. At that time, we had few sellers and insatiable demand. It’s much milder now, but it’s a real trend.
The new listings rate has remained super low. We’ve been talking about how few sellers there are out there right now. There were only 66,000 new listings of single-family homes this week. 16,000 of those are already in contract. In the chart below, each bar is a week.
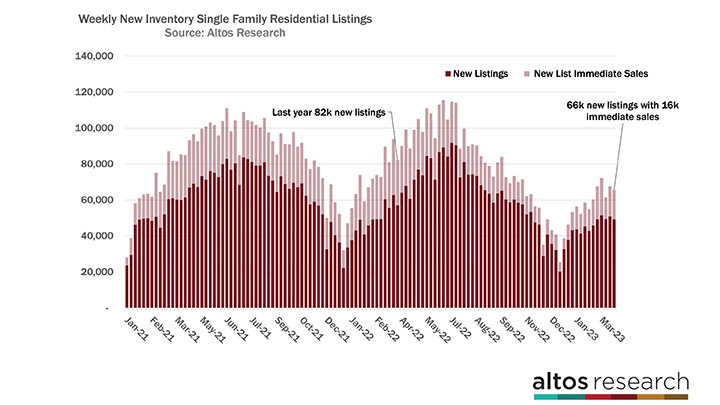
The taller the bar, the more new listings that week. The light portion of the bar represents those that went into contract immediately after listing — immediate sales. Since July 2022, there have been far fewer homes for sale than in previous years. The volume of new listings hasn’t picked up at all for the spring season. The big takeaway here is that there are no signs anywhere in the data that we have any surge of inventory coming. It’s much more likely that the supply of homes in 2023 stays closer to the COVID-19 pandemic lows. We have a shortage of homes available to buy in this country.
If the economy slows or we get big shocks, we can see how inventory would climb. It did in 2022. We expected it to happen this year, but the later we get into the quarter without that climb means that the whole year will likely stay in shortage. The effects of the recession on housing inventory will extend into 2024 or maybe even into 2025 now. Isn’t that a different perspective than we’ve been expecting?
Prices
The median home price of a U.S. single-family home ticked up this week to $437,500. Home prices are inching up each week as you’d expect in the spring. However, each week the comparison with 2022 compresses a bit more. Home prices last spring were still climbing rapidly each week. This is why the headlines you’ll read over the next few months will still report home prices declining even though home prices are not declining. The comparison to last year is what’s getting worse.
The median price of the new listings — these are all the homes that came to market this week — is $400,000. That’s the light red line on the chart below. That’s a downward trend from last week and 4% lower than last year at this time. The price of the new listings is a bit noisy from week to week. Sometimes it bounces up and sometimes down.
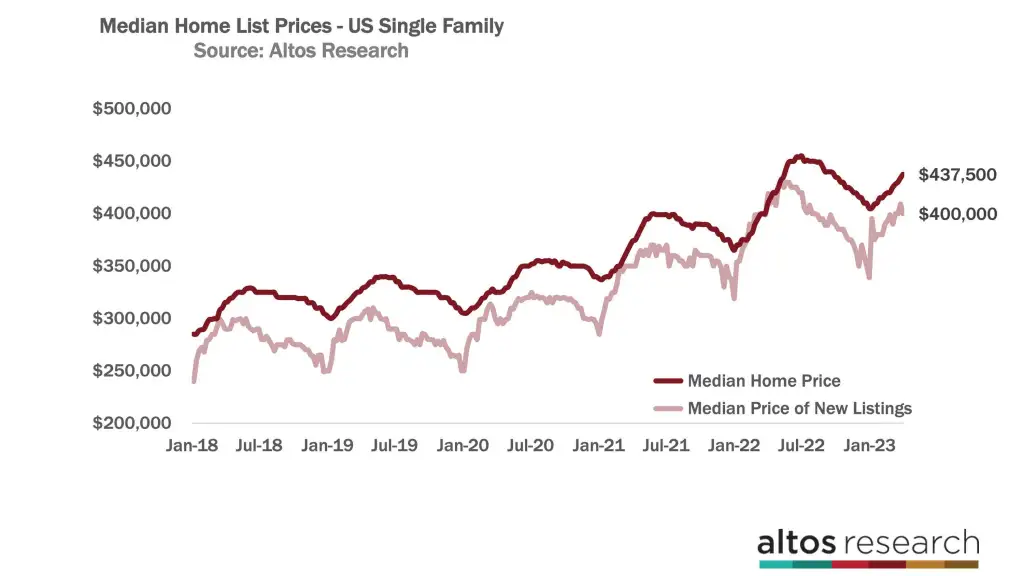
The important takeaway is that this is a leading indicator of where sales will happen in the future. This leading indicator has less and less favorable comparisons with 2022 until May. We know that housing demand is far lighter than it was last year at this time. And we can see that prices are not climbing dramatically from here. They’re inching up. In 2022 they were rocketing up. It doesn’t look like the market will hit the same peak of prices as 2022. But we can also see very clearly that home prices are not declining. It’s a very tricky message to communicate.
Along those same lines, we’ve been sharing the pending sales data more frequently in these videos, because it shows the price points where people are buying before the sale actually completes. The median price of the homes pending contract is $375,000 that’s 1.3% lower nationally than in 2022 at this time. These are not seasonally adjusted numbers. It counts all the homes in contract right now across the country. Again these are sales not yet complete. The sales will close in April and May and be reported in the headlines in June and July.
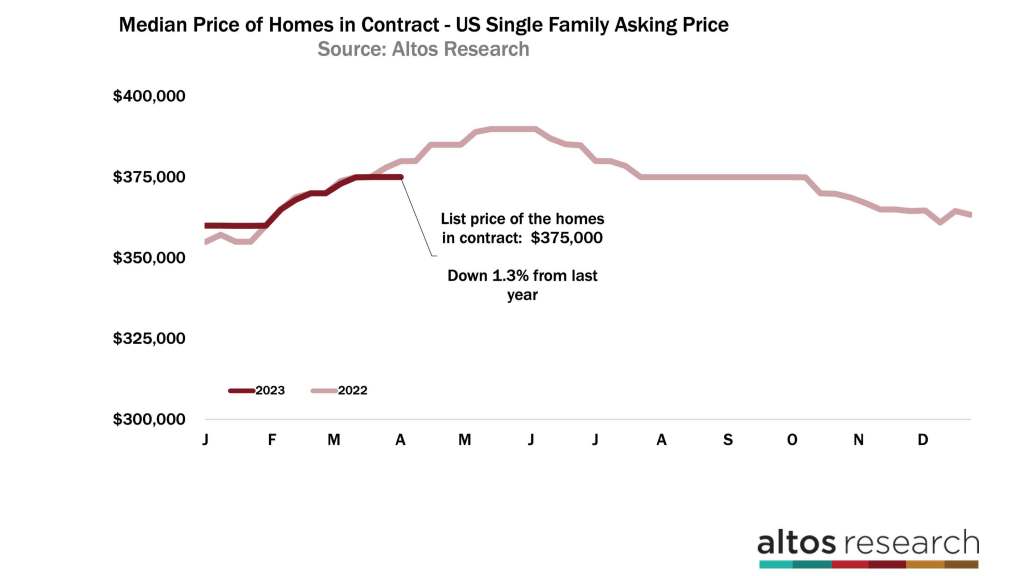
The difference from the 2022 sales price is actually a little bigger than this 1.3%. Last year we had bidding wars, so the sales price was on average a touch higher than the asking price. This year that’s no longer true.
Over the next few weeks, we expect the pending sales price to tick up but not nearly as quickly as it did in 2022. So we’ll have this same phenomenon of rising home prices but the price drop in comparison to last year will be getting bigger. The home price drops happened in July and October last year. So through June, our annual comparisons will be larger and larger. That’s going to be confusing for casual observers in the market. Prices are not declining, the comparison with last year is declining though.
More next week.


