National Growth in Buyer Foot Traffic Largest in the History of the Showing Index®
Key Points:
• U.S. showing traffic rose by 20.2 percent year over year in January, marking the most significant gain nationwide since the Showing Index began tracking buyer activity
• The number of appointments per listing have gone up to record levels, according to showing activity recorded in ShowingTime systems
• The West Region realized the greatest year-over-year improvement in activity for the second consecutive month, with a 34.1 percent uptick in showings
The chill of winter’s first full month failed to cool home buyer activity, as January showing traffic saw significant year-over-year increases across all regions throughout the U.S., according to the latest ShowingTime Showing Index report.
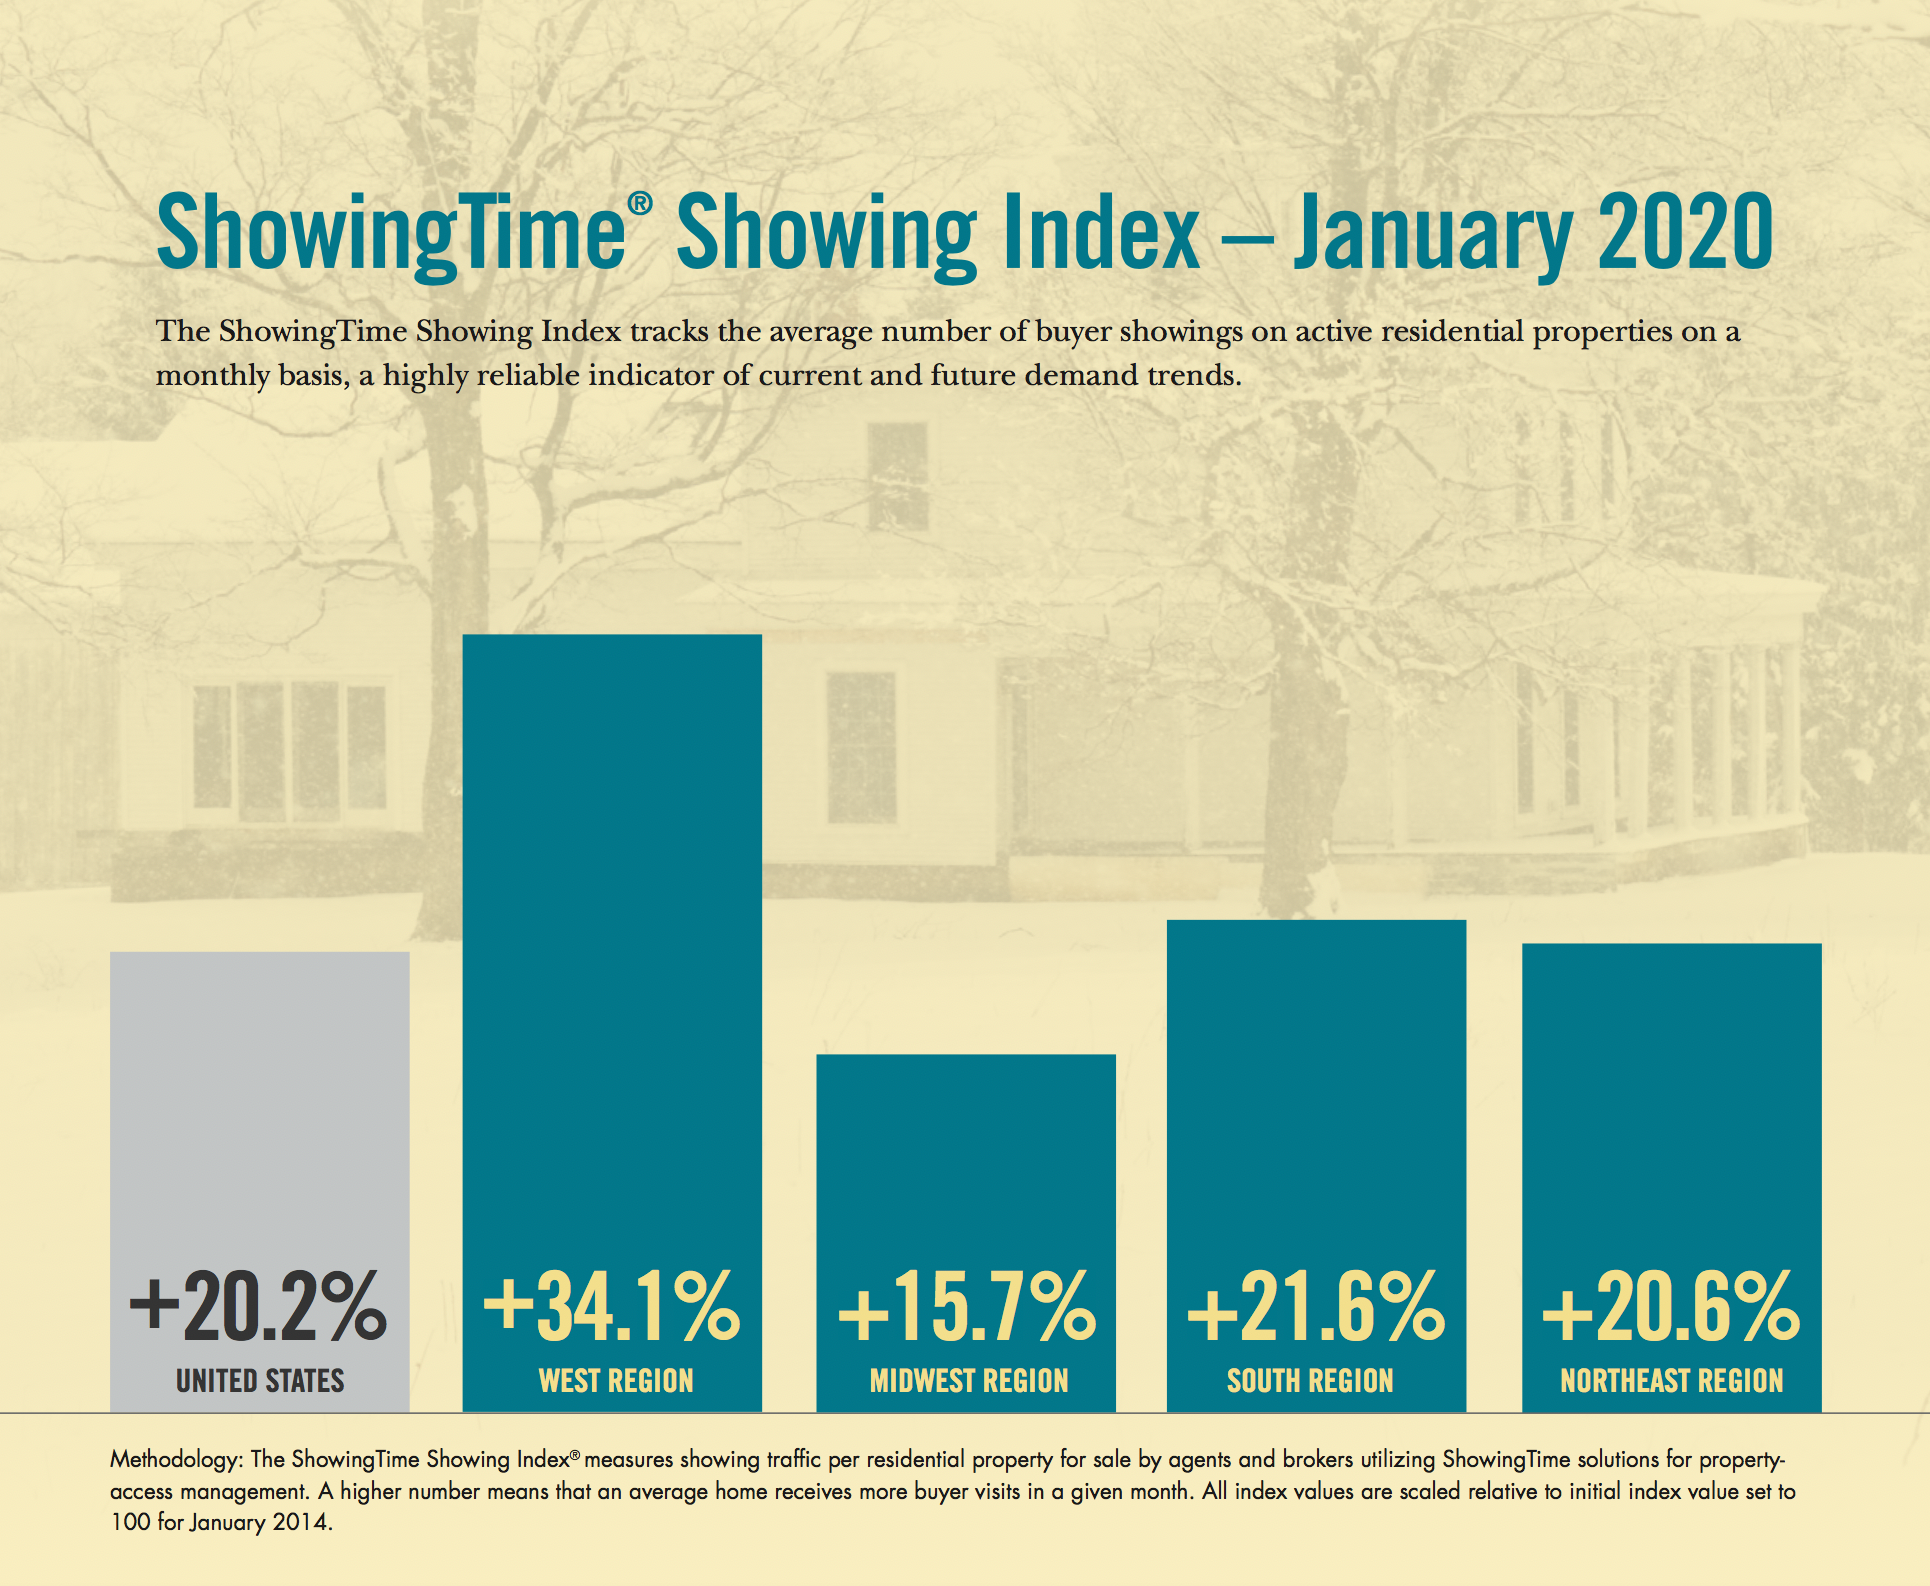
The 20.2 percent year-over-year jump in national showing traffic in January was the most significant recorded in the history of the Showing Index. The West again topped regional growth last month, with a 34.1 percent increase compared to January 2019. The South and Northeast reported similar gains in buyer traffic, at 21.6 percent and 20.6 percent, respectively. The Midwest’s 15.7 percent year-over-year increase rounded out the regional gains in January.
“We continue to see substantial increases in buyer traffic,” said ShowingTime Chief Analytics Officer Daniil Cherkasskiy. “While only a portion of the markets showed spikes in November – December 2019, showing traffic increased
across the board for almost all markets in January.
“It’s important to note that January 2019 traffic was somewhat subdued due to extreme weather conditions in parts of the country at the time, reflecting an exaggerated year-over-year growth for January 2020,” he added. “Even so, the number of appointments per listing have gone up to record levels based on activity we see in our systems, suggesting that the housing market will be quite competitive this spring.”

The ShowingTime Showing Index, the first of its kind in the residential real estate industry, is compiled using data from property showings scheduled across the country on listings using ShowingTime products and services, providing a benchmark to track buyer demand. ShowingTime facilitates more than five million showings each month.
Released monthly, the Showing Index tracks the average number of appointments received on active listings during the month. Local MLS indices are also available for select markets and are distributed to MLS and association leadership. To view the full report, visit https://www.showingtime.com/showingtime-showing-index/.
About ShowingTime
ShowingTime is the residential real estate industry’s leading showing management and market stats technology provider, with more than 1.2 million active listings subscribed to its services. Its showing products and services simplify the appointment scheduling process for real estate professionals, buyers and sellers, resulting in more showings, more feedback and more efficient sales. Its MarketStats division provides interactive tools and easy-to-read market reports for MLSs, associations, brokers and other real estate companies, as well as a recruiting tool for brokers. ShowingTime products are used in 370 MLSs representing nearly one million real estate professionals across the U.S. and Canada. For more information, contact us at research@showingtime.com n


