May Home Prices Increased by 3.6% Year Over Year
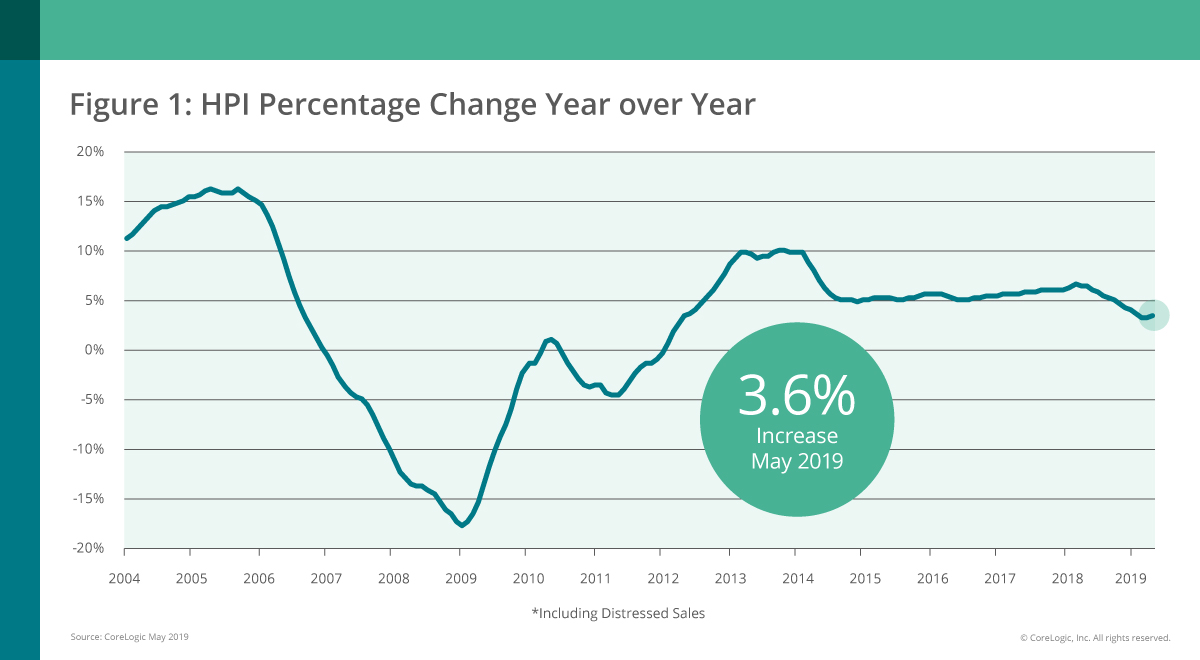
Home prices rose both year over year and month over month, according to CoreLogic Home Price Index (HPI™) and HPI Forecast™ for May 2019.
Home prices increased nationally by 3.6% from May 2018. On a month-over-month basis, prices increased by 0.9% in May 2019. (April 2019 data was revised. Revisions with public records data are standard, and to ensure accuracy, CoreLogic incorporates the newly released public data to provide updated results each month.)
After several months of moderation earlier this year, the CoreLogic HPI Forecast indicates home prices will increase by 5.6% from May 2019 to May 2020. On a month-over-month basis, home prices are expected to increase by 0.8% from May 2019 to June 2019, bringing single-family home prices to an all-time high.
The CoreLogic HPI Forecast is a projection of home prices calculated using the CoreLogic HPI and other economic variables. Values are derived from state-level forecasts by weighting indices according to the number of owner-occupied households for each state.
“Interest rates on fixed-rate mortgages fell by nearly one percentage point between November 2018 and this May,” said Dr. Frank Nothaft, chief economist at CoreLogic. “This has been a shot-in-the-arm for home sales. Sales gained momentum in May and annual home-price growth accelerated for the first time since March 2018.”


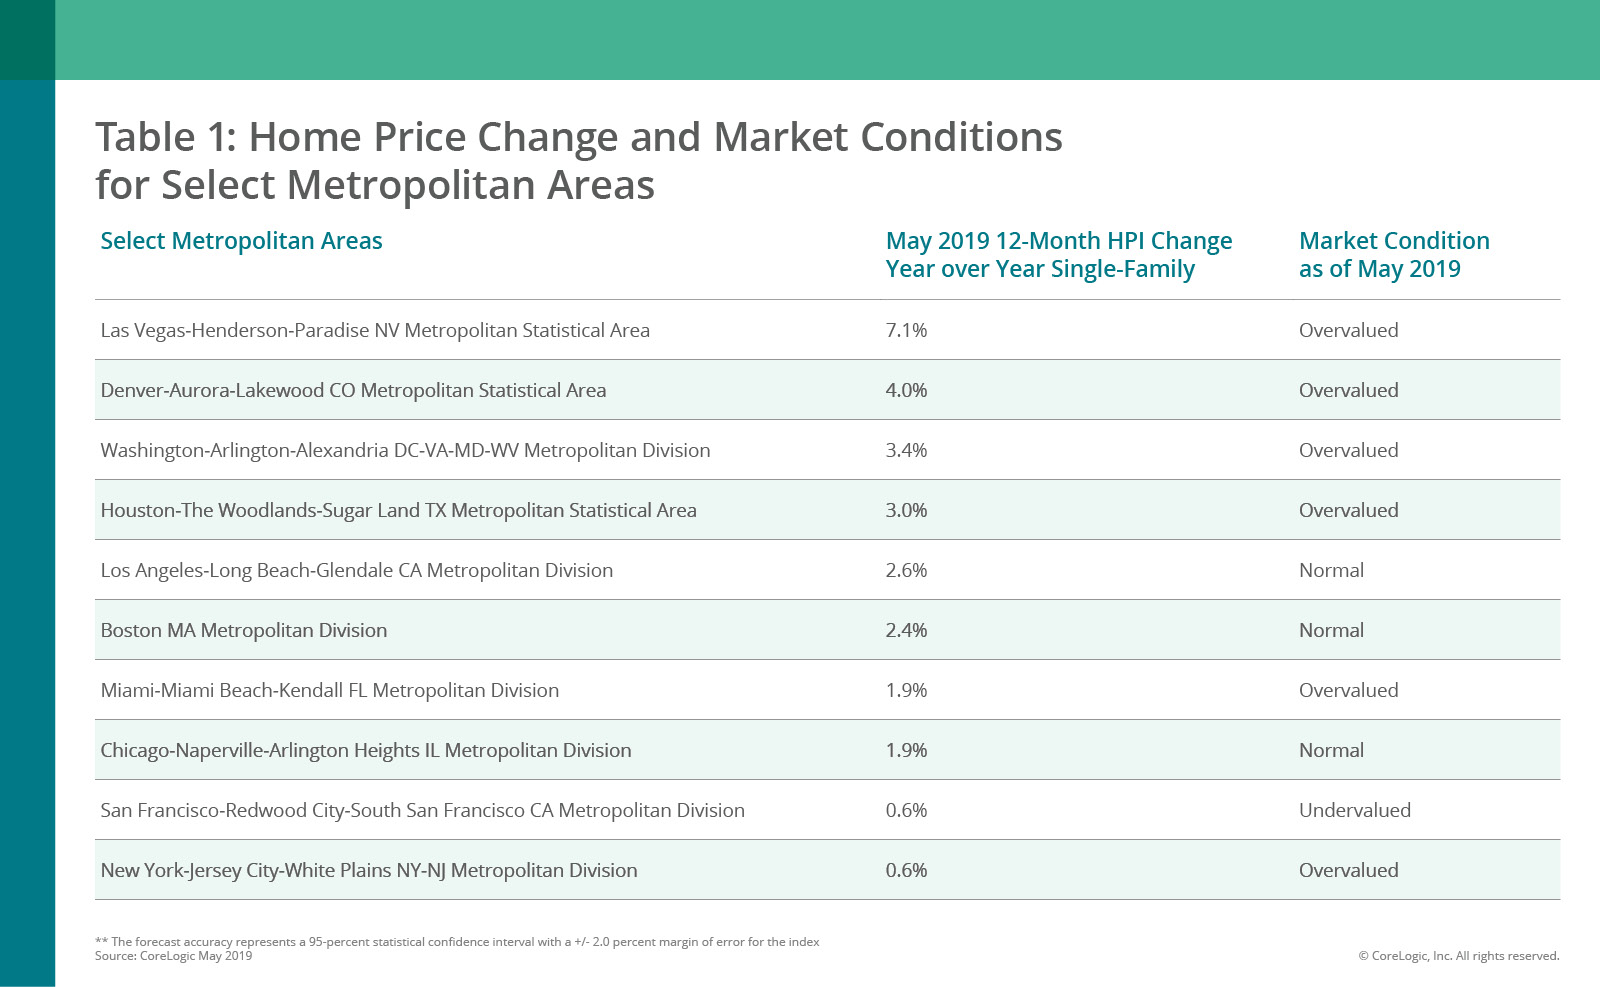
According to the CoreLogic Market Condition Indicators (MCI), an analysis of housing values in the country’s 100 largest metropolitan areas based on housing stock, 38% of metropolitan areas have an overvalued housing market as of May 2019.
The CoreLogic MCI analysis categorizes home prices in individual markets as undervalued, at value or overvalued, by comparing home prices to their long-run, sustainable levels, which are supported by local market fundamentals such as disposable income. As of May 2019, 24% of the top 100 metropolitan areas were undervalued, and 38% were at value.
When looking at only the top 50 markets based on housing stock, 42% were overvalued, 16% were undervalued and 42% were at value. The CoreLogic MCI analysis defines an overvalued housing market as one in which home prices are at least 10% above the long-term, sustainable level. An undervalued housing market is one in which home prices are at least 10% below the sustainable level.
During the first quarter of 2019, CoreLogic together with RTi Research of Norwalk, Connecticut, conducted an extensive survey measuring consumer-housing sentiment in high-priced markets. Given the significant increases in home prices in these markets, homeowners are questioning their ability to afford replacement homes, and 28% of homeowners reported they are concerned they won’t be able to afford buying a new home in the future.
Only half of the respondents are satisfied with the number of options available in their market, and 40% of homeowners who are considering selling said they would have to move outside of their current market to afford another home.
“The recent and forecasted acceleration in home prices is a good and bad thing at the same time,” said Frank Martell, president and CEO of CoreLogic. “Higher prices and a lack of affordable homes are two of the most challenging issues in housing today, and every buyer, seller and industry participant is being impacted.
The long-term solution lies in expanding supply, which will require aggressive and effective collaboration between policy makers, state and local government entities and home builders.”


