CoreLogic Reports August Home Prices Increased by 5.5 Percent Year Over Year
Homeowners Expect Sale of Current Home to Fund Downpayment for Next Purchase.
- Homeowners waiting to sell, hoping to afford larger down payment on next home
- Nevada and Idaho were the only states to post double-digit annual price growth in August
- Home prices projected to increase 4.7 percent by August 2019
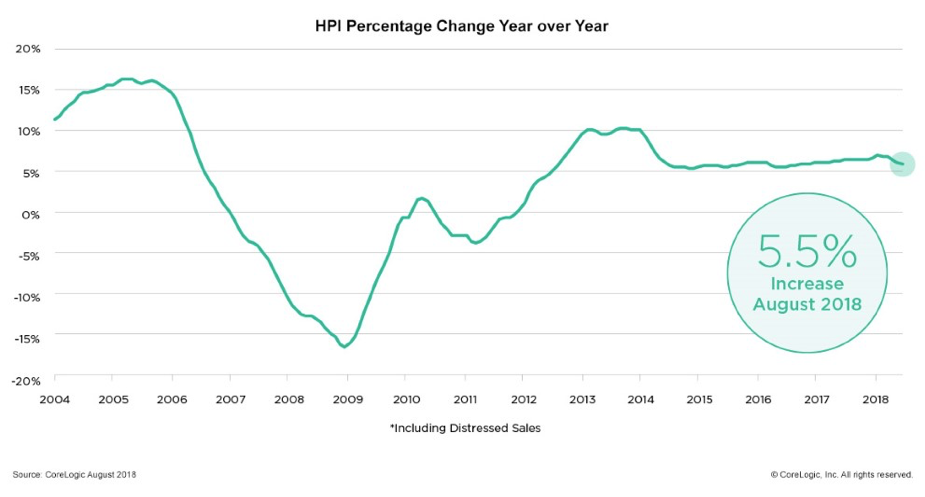
CoreLogic® (NYSE: CLGX), a leading global property information, analytics and data-enabled solutions provider, today released the CoreLogic Home Price Index (HPI™) and HPI Forecast™ for August 2018, which shows home prices rose both year over year and month over month. Home prices increased nationally by 5.5 percent year over year from August 2017. On a month-over-month basis, prices increased by 0.1 percent in August 2018. (July 2018 data was revised. Revisions with public records data are standard, and to ensure accuracy, CoreLogic incorporates the newly released public data to provide updated results each month.)
Looking ahead, the CoreLogic HPI Forecast indicates that the national home-price index is projected to continue to increase by 4.7 percent on a year-over-year basis from August 2018 to August 2019. On a month-over-month basis, home prices are expected to decrease by 0.4 percent from August to September 2018. The CoreLogic HPI Forecast is a projection of home prices calculated using the CoreLogic HPI and other economic variables. Values are derived from state-level forecasts by weighting indices according to the number of owner-occupied households for each state.
“The rise in mortgage rates this summer to their highest level in seven years has made it more difficult for potential buyers to afford a home,” said Dr. Frank Nothaft, chief economist for CoreLogic. “The slackening in demand is reflected in the slowing of national appreciation, as illustrated in the CoreLogic Home Price Index. National appreciation in August was the slowest in nearly two years, and we expect appreciation to slow further in the coming year.”
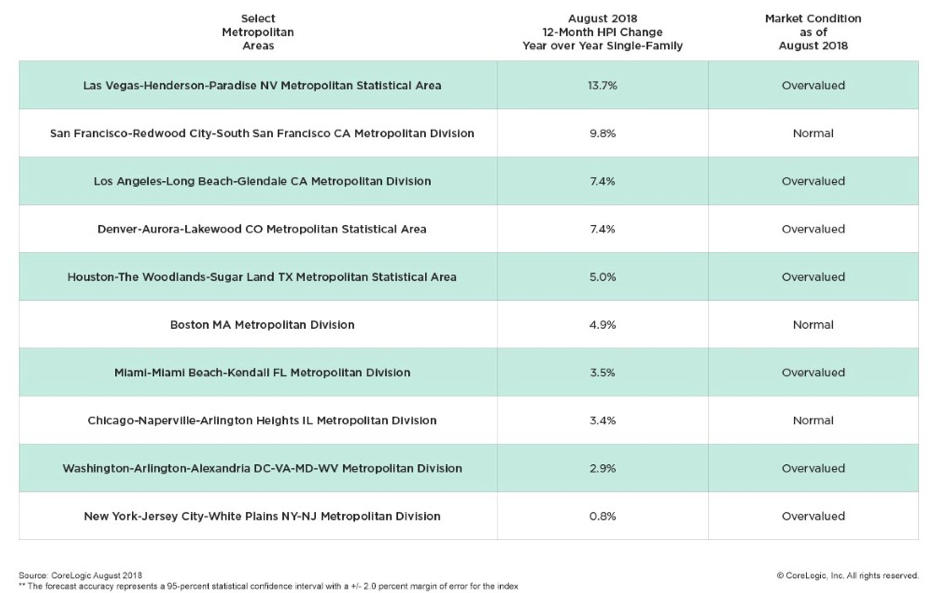
According to the CoreLogic Market Condition Indicators (MCI), an analysis of housing values in the country’s 100 largest metropolitan areas based on housing stock, 38 percent of metropolitan areas have an overvalued housing market as of August 2018. The MCI analysis categorizes home prices in individual markets as undervalued, at value or overvalued, by comparing home prices to their long-run, sustainable levels, which are supported by local market fundamentals (such as disposable income).
Additionally, as of August 2018, 18 percent of the top 100 metropolitan areas were undervalued, and 44 percent were at value. When looking at only the top 50 markets based on housing stock, 46 percent were overvalued, 12 percent were under-valued and 42 percent were at value. The MCI analysis defines an overvalued housing market as one in which home prices are at least 10 percent higher than the long-term, sustainable level. An undervalued housing market is one in which home prices are at least 10 percent below the sustainable level.
In 2018, CoreLogic together with RTi Research of Norwalk, Connecticut, conducted an extensive consumer housing sentiment study, combining consumer and property insights. The study assessed attitudes toward homeownership and the drivers of the home buying or renting decision process. August data indicates that, while home prices are cooling, they are still rising in most markets.
Home sales are down in some metros, in part because sellers believe prices will continue to rise and that by waiting, they can sell their homes for a better price. Many intend to use proceeds from the sale of their current home to fund the downpayment of their next home. Sixty-six percent of homeowners who are considering buying in the next 10 years will need to sell their current homes to finance their next one. Meanwhile, 35 percent of recent homebuyers said they used funds from the sale of their previous home to finance the downpayment of their current home.
“In some markets, homebuyers and sellers are remaining cautious and taking a pause as price appreciation continues to rise,” said Frank Martell, president and CEO of CoreLogic. “By waiting to sell, homeowners believe they will get the greatest return on their investment; the more money they have for a downpayment, the easier the purchase payments will be for their next home.”
Figure 1: National Home Price Change

Table 1: Home Price Change and Market Conditions for Select Metropolitan Areas

Methodology
The CoreLogic HPI™ is built on industry-leading public record, servicing and securities real-estate databases and incorporates more than 40 years of repeat-sales transactions for analyzing home price trends. Generally released on the first Tuesday of each month with an average five-week lag, the CoreLogic HPI is designed to provide an early indication of home.


