This week’s real estate market data includes Memorial Day. Mortgage rates did ratchet back below 7% from a week prior, but maybe that is because of the holiday weekend. The home sales rate did not pick up this week. The rate of new pending home sales fell by 5% this week. That number should rebound a bit in next week’s report, but it remains to be seen whether mortgage rates at nearly 7% are really any better for home buyers than rates just over 7%.
This week really contrasts with the trends of the last few months. Home buyers are ready for any opportunity. Recently, I was talking with a mortgage lender about his observation of all the pent-up demand out there for homes. It’s like we have all this shadow demand that is just waiting for any new selection to arrive, or maybe any crack in affordability.
If you recall, one of the persistent, bearish arguments over the years is that we have a “shadow inventory” of sellers. Meaning people who are ready to sell but who aren’t yet selling. However, “shadow demand” may be a more apt description of what is going on right now. These are potential buyers waiting for any new inventory, or for rates or prices to drop. And when they do, these buyers are ready to pounce. This is why we could call it “shadow demand” — it doesn’t show up in things like the mortgage purchase applications, but it’s out there and it’s reasonably well-financed. Ready to act. Our friends at John Burns Real Estate Consulting pointed out that May was a “phenomenal” month for new home sales. You don’t have phenomenal sales months without underlying demand.
Inventory
There are 436,000 single-family homes on the market across the U.S. now. That’s up just a fraction of a percent from last week. There are very few active sellers. There are 16% more homes on the market now than in 2022 at this time. We started 2023 with about 70% more homes on the market than the year prior.
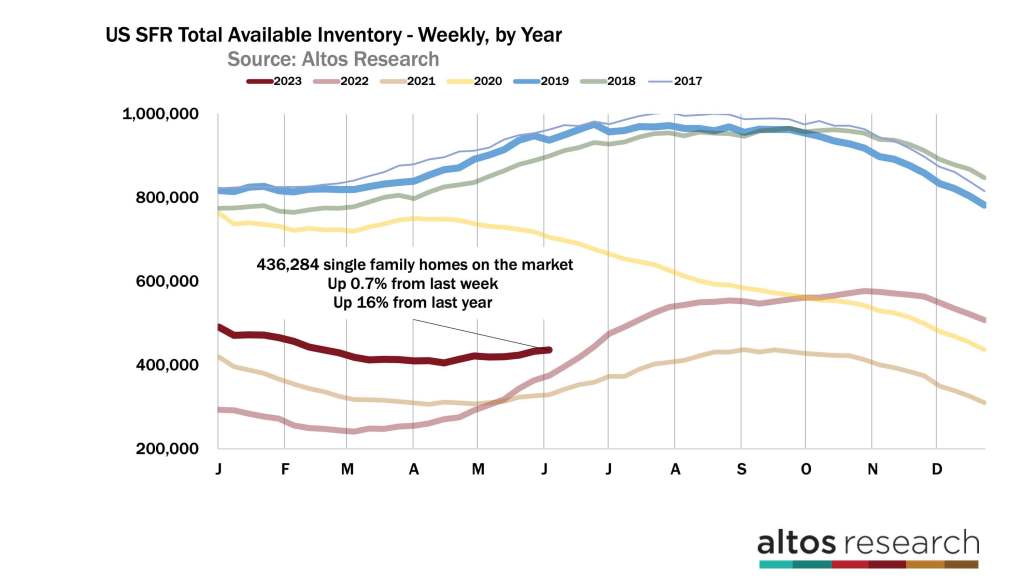
Inventory grew by 0.7% this week which is what the forecasting model expected for the holiday week. The model expects 3% inventory growth each of the next three weeks. The peak of the spring inventory is now. But at the constricted pace we’ve been facing this year, the model has been consistently over-estimating. By this metric, in mid-July we’ll have negative year-over-year inventory growth. One observation is that shrinking inventory year over year is generally associated with home price increases another year out. So that bodes mildly bullish for home prices in 2024.
You can see the shape of the curves here in this chart. The dark red line represents the weekly inventory of unsold single-family homes in 2023. In 2022, inventory was increasing by 5-7% per week. It seems very unlikely that we’ll have any surge in inventory. A restricted supply supports future home prices
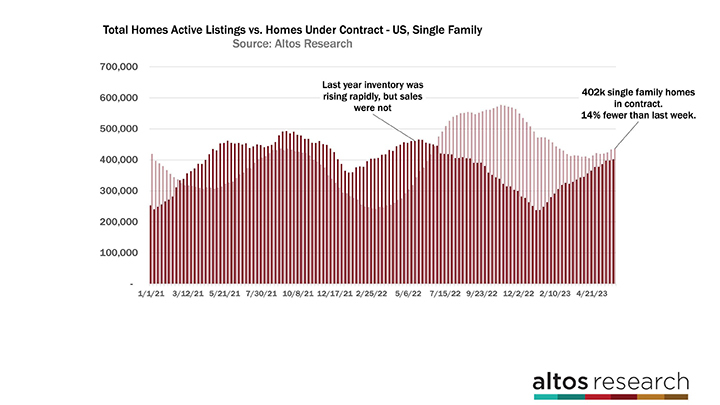
While there are 436,000 homes on the market, there are now 402,000 single-family homes in contract. The rate of sales is slowly climbing and closing the gap from 2022. There are 13% fewer homes in contract now than in 2022 at this time. At the start of 2023 there were 35% fewer homes in contract than the year prior. During the COVID-19 Pandemic, there were more homes in contract at any given moment than there were active listings on the market. That trend changed in 2022 when demand cooled and inventory increased. That got us closer to a normal level of inventory. But since demand has increased this year and supply is so restricted, the data shows we’re getting closer to having as many pending as for sale. If you’re still in the camp that thinks there is no demand for homes, this is a really notable trend. That trend took a pause the last two weeks with the holiday and the mortgage jump. I expect the trend to resume in next week’s report.
In the chart below, the height of the dark bars is the total count of homes in contract the pending stage. The light bar represents the total inventory. You can see how the pending sales volume is approaching the total inventory again.
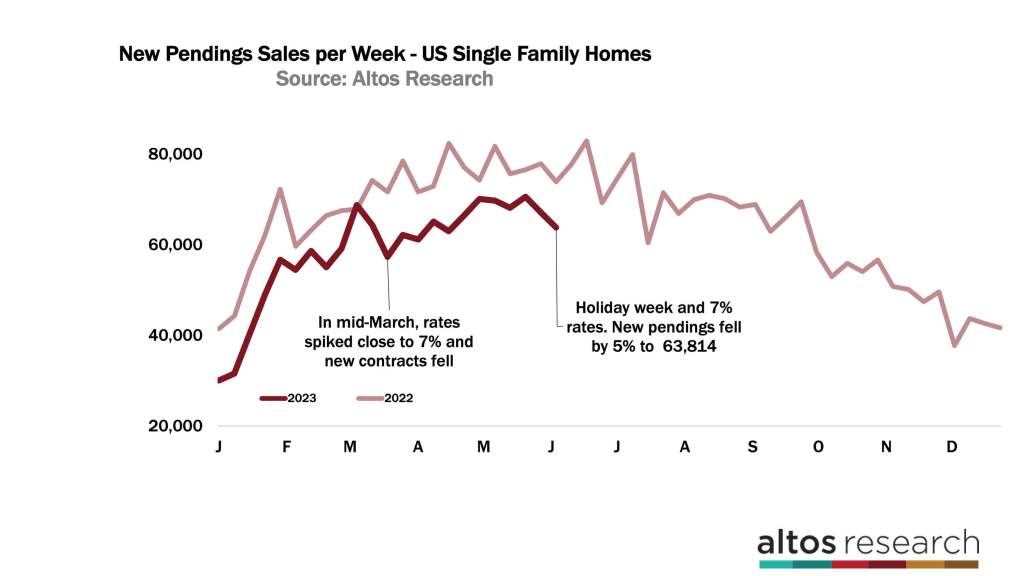
There were only 64,000 new contracts for single-family homes this week. In this chart below, the dark red line represents 2023 and you can really see the sales rate slowdown for the holiday. This is also a week when mortgage rates are still very close to 7%, so purchases have not rebounded yet from last week’s big drop. It’s June so I think it’s very likely that next week’s report will see a rebound in the new contract volume. You can see the jump last year in the light red line — even in retrospect we know that demand was slowing way down. Each year that volume peaks in June. The details I’ll be looking for here are whether 7% is an actual threshold and if we’re at 6.9% mortgage rates, do people buy? It’s hard to imagine a big jump in purchases even though rates are down from that spike 10 days ago. But as I mentioned we can see anecdotally the “shadow demand.” There are homebuyers just waiting for any opportunity, and maybe a 20 basis point drop is part of that opportunity.
Price
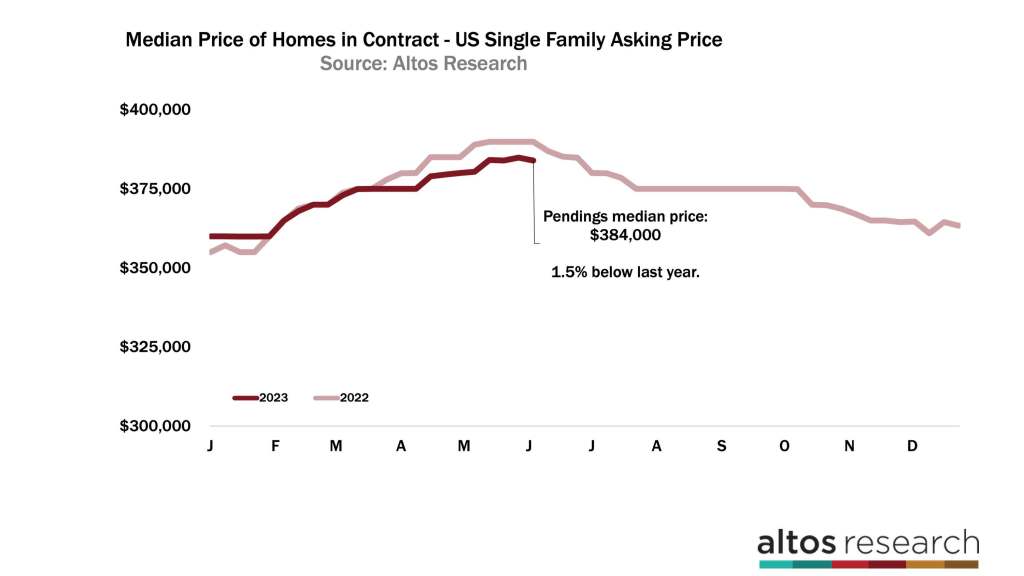
The price of the homes in contract ticked down this week. We’re at the seasonal peak so it’s not a surprise. The median price of the single-family pending sales is $384,000. That’s down a fraction from last week and 1.5% below 2022 at this time. In July, the dark red line from 2023 will probably be able to catch the light red line from 2022. Home prices are down just a touch from last year. They adjusted down very quickly in July and again in October 2022. If mortgage rates stay at or above 7%, then we could see prices fall again and finish 2023 with home prices down for the year.
It seems that the consensus on mortgage rates is that the spreads with the 10-year will compress later in the year and therefore mortgage rates will fall to maybe even as low as 5.5%. I don’t predict mortgage rates, so I don’t know if that’ll happen. But if it does it feels like this shadow demand will jump in quickly and that will definitely keep a floor on home price adjustments, just as it did in the first half of the year.
Across the country, the median price of single-family homes is $450,000. That’s unchanged from last week. The market has a tendency to sit at the big round numbers. These are psychological barriers so we get a large number of properties that price around the same level. $450,000 is unchanged from 2022. The price of homes on the market is the same as they were a year ago. I expect that red line to stay around this plateau for a few weeks before dipping at the 4th of July holiday.
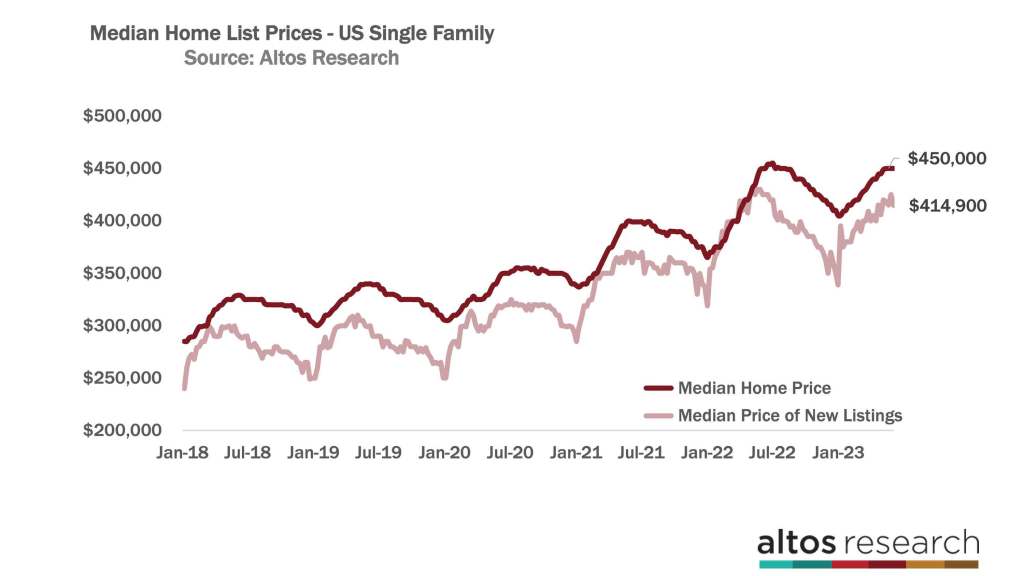
With the newly listed cohort this week, we know there are vanishingly few new listings. The price of these homes is 414,900. That’s down from last week and 3% lower than 2022 at this time.
And the last indicator of demand we’ll cover today is the price reductions. Just over 30% of the homes on the market have taken a price cut. This is a totally normal level. Just 10 basis points more than last week. This time of year price reductions are usually accelerating much more quickly. But this year because inventory is so restricted and demand has remained sufficient all year, few sellers have had to cut their prices.
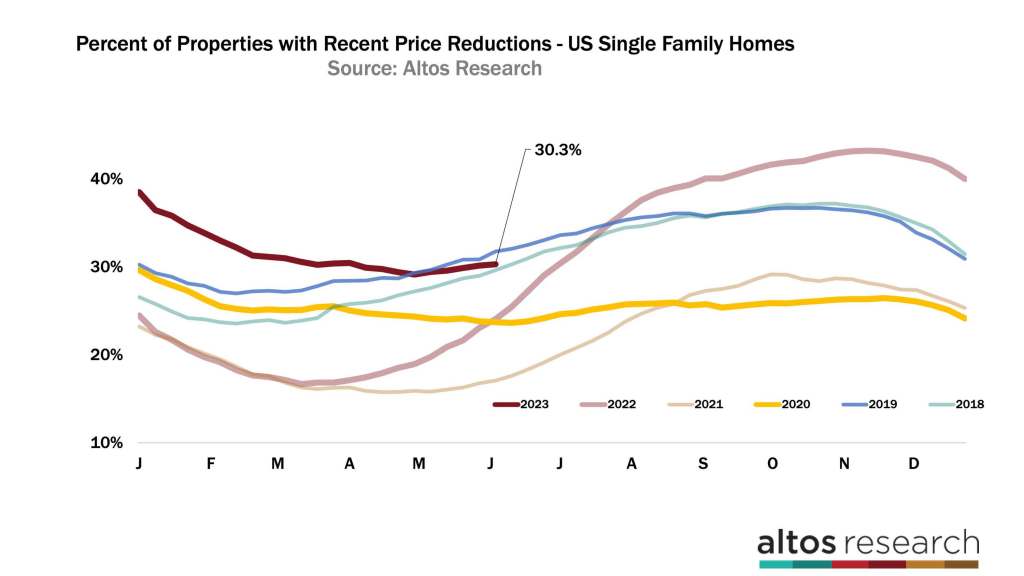
The seasonal changes were late this year. Inventory usually bottoms in January or February and this year it kept falling until mid-April. Therefore you can expect the price reductions will rise slowly too. Houses have to be on the market for weeks or months with no offers before they choose to do a price reduction. We’ll see price cuts pick up in June and July, but not until we’re surpassed by the levels in 2018, 2019 and 2022. Basically, by the third quarter, we’ll have fewer price cuts than any year except the two peak pandemic years. That’s what I mean by this shadow demand we can see.
Mike Simonsen is president of Altos Research.


